Debugging and Profiling
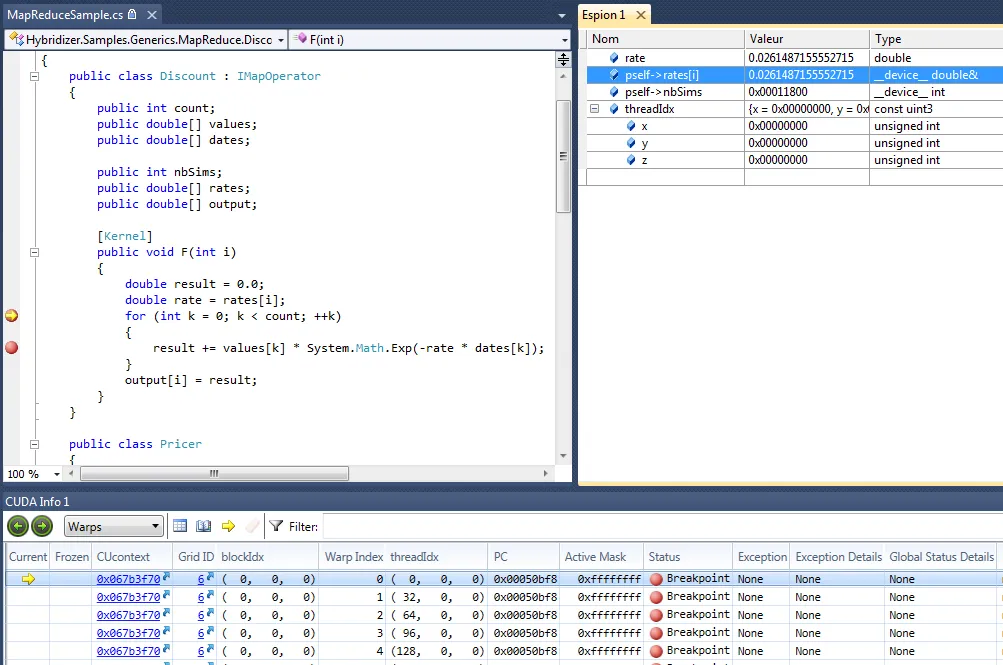
If debug information is available in the input binary (java or dot net), it is re-inserted into the generated source code allowing users to benefit from debugging on the target environment. Illustrated here, a snapshot of a debugging session in NSIGHT Visual Studio edition.
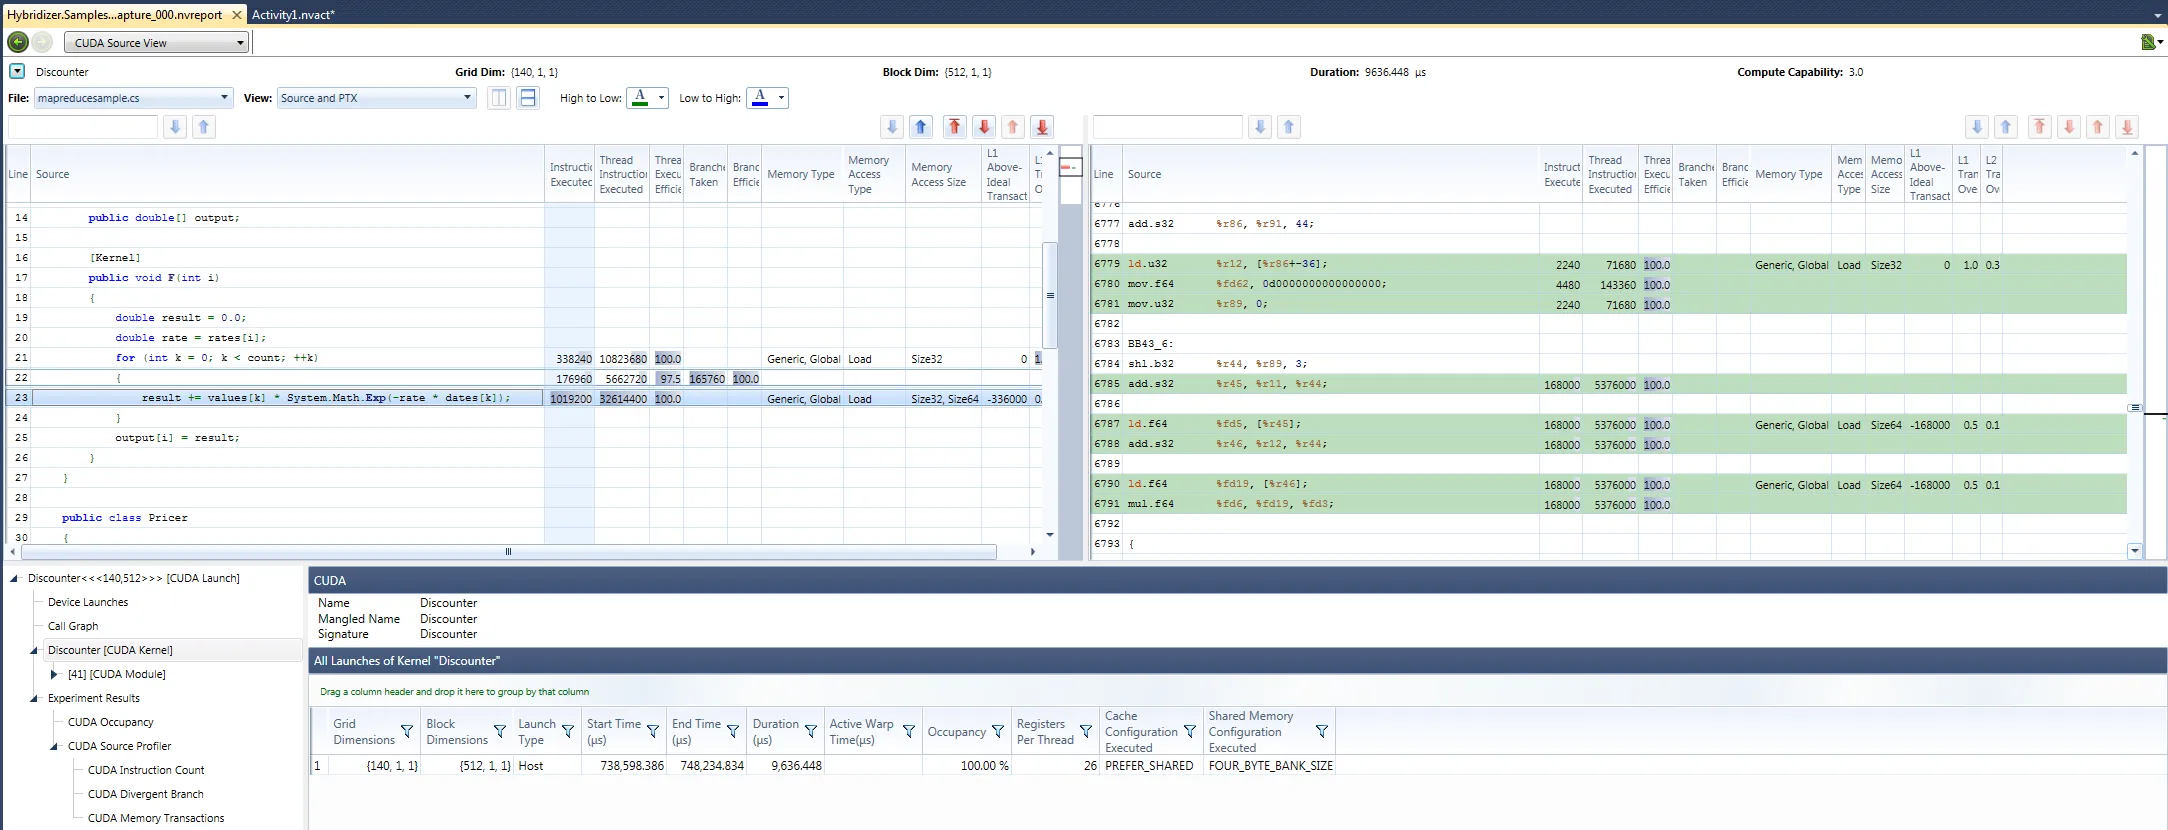
It also integrates in profilers such as NSIGHT Visual Studio edition or Intel VTUNE Amplifier.